
(Natural News) The scandal that I call “The Greatest Scientific Fraud Of All Time” is the alteration of official world temperature data by a small number of government employees in the US and the UK. Uniformly, the alterations have the effect of lowering temperatures early in the record, and raising recent temperatures, in order to create and enhance a warming trend that does not exist in the data as originally reported. The purpose of the fraudulent data alteration is to support the continuation of the “global warming” climate scare. To read the prior 22 posts in this series, go to this link.
(Article by Francis Menton republished from ManhattanContrarian.com)
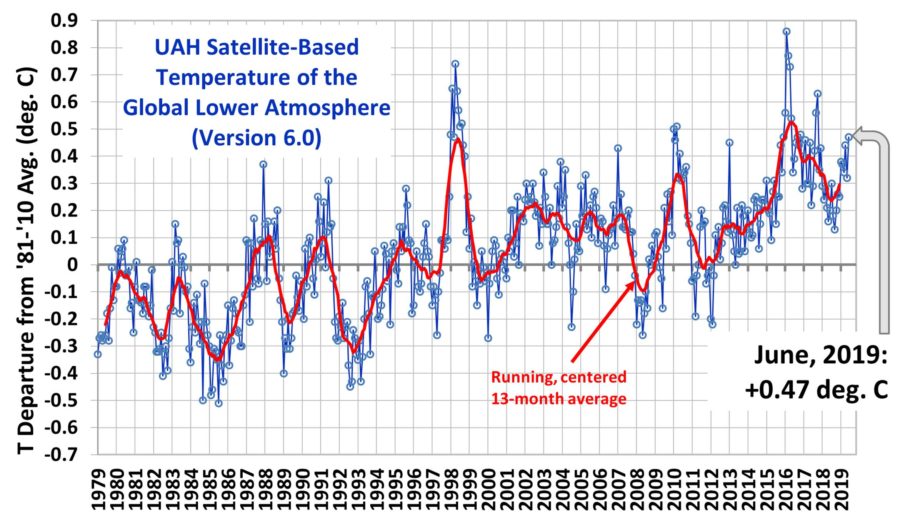
Despite what you might think from reading the mainstream press, the past few years in world temperatures have not been particularly good for the continuation of climate alarm. No matter how you measure them (the main methods being ground thermometers, weather balloons, and satellites), world atmospheric temperatures have gone down for more than three years since a peak reached in early 2016. The data set that I consider to be the most reliable — the satellite-based measurements from the University of Alabama at Huntsville — gives the global temperature “anomaly” for the most recent month (June 2019) as +0.47 deg C. That is well down from the peak of +0.88 deg C in early 2016, and represents a decrease of about a third of what had been the entire increase since the satellite record began in 1979. Here is the most recent UAH global lower atmosphere temperature graph:
The failure of temperatures to continue to rise in accordance with alarmist model predictions has left the alarm-promoting guys at NASA and NOAA without fodder for their former annual “hottest year ever!!!” press releases. From the NASA end-of-year-2018 release:
Support our mission and enhance your own self-reliance: The laboratory-verified Organic Emergency Survival Bucket provides certified organic, high-nutrition storable food for emergency preparedness. Completely free of corn syrup, MSG, GMOs and other food toxins. Ultra-clean solution for years of food security. Learn more at the Health Ranger Store.
2018 Was the Fourth Warmest Year, Continuing Long Warming Trend. . . . The 2018 global temperature average ranks behind 2016, 2017, and 2015.
I leave it for you to figure out how a year that was down from 2017, which in turn was down from 2016, somehow “continues[es] [a] long warming trend.” In a real “long warming trend,” shouldn’t each year be successively warmer than the previous year?
So what is to be done? Readers of this series will not be surprised to learn that in this period where not so many people are looking, the temperature adjusters have been beavering away in the bowels of their collections of data, continuing to send inconvenient readings of the past down the memory hole, and to “adjust” the temperatures of the past down, and of the present up. Let me provide a small roundup of some things that have been discovered recently.
At NoTricksZone on June 25, Pierre Gosselin posts some work by a Japanese guy named Kirye. Kirye is a Japanese climate skeptic Twitter-blogger, but his Twitter page is in Japanese, so you probably won’t be able to read it. Kirye noticed that NASA came out on June 14 with a new version, version 4, of its surface-thermometer-based temperature series known as GISTEMP. GISTEMP v.4 is now based on the records of the also-newly-adjusted Global Historical Climate Network group of temperature stations, now called GHCN v.4. Kirye then analyzes the new data from NASA at six particular and widely-scattered weather stations: Punta Arenas, Chile; Marquette, Michigan; Port Elizabeth, South Africa; Davis, Antarctica; Hachijojima, Japan; and Valencia, Ireland.
Sure enough, there have been additional adjustments, as always in the same direction — older down, and newer up. But those adjustments between v.3 and v.4 have been relatively minor. More significantly, Kirye discovered a different maneuver which is even more incredible, and which he proves by direct links back to NASA’s own website: In the v.4 graphs that it provides, NASA has relabeled the hugely-adjusted v.3 data as “unadjusted.”
Read more at: ManhattanContrarian.com and Climate.news.